DevOps Project: Deployment of Java Application on Kubernetes
Overview
This project demonstrates a production-style DevOps CI/CD pipeline for a Java-based application, automated using Jenkins and deployed on a Kubernetes cluster.
It focuses on build automation, code quality, security scanning, containerization, orchestration, and observability.
The pipeline ensures reliable, repeatable, and secure application delivery from source code to Kubernetes.
Architecture
- Jenkins for CI/CD orchestration
- Maven for build and dependency management
- SonarQube for static code analysis
- Nexus Repository for artifact storage
- Docker for containerization
- Kubernetes for application deployment and load balancing
- Prometheus and Grafana for monitoring
- AWS EC2 for infrastructure
Purpose & Objectives
- Automate the complete software delivery lifecycle
- Reduce manual intervention and deployment errors
- Improve code quality and security early in the pipeline
- Deploy Java applications reliably on Kubernetes
- Monitor system health and performance in real time
Key Objectives
- Implement a Jenkins-based CI/CD pipeline
- Integrate quality and security checks (DevSecOps)
- Manage build artifacts using Nexus Repository
- Containerize the application with Docker
- Deploy and scale the application on Kubernetes
- Enable monitoring and alerting
- Configure email notifications for pipeline status
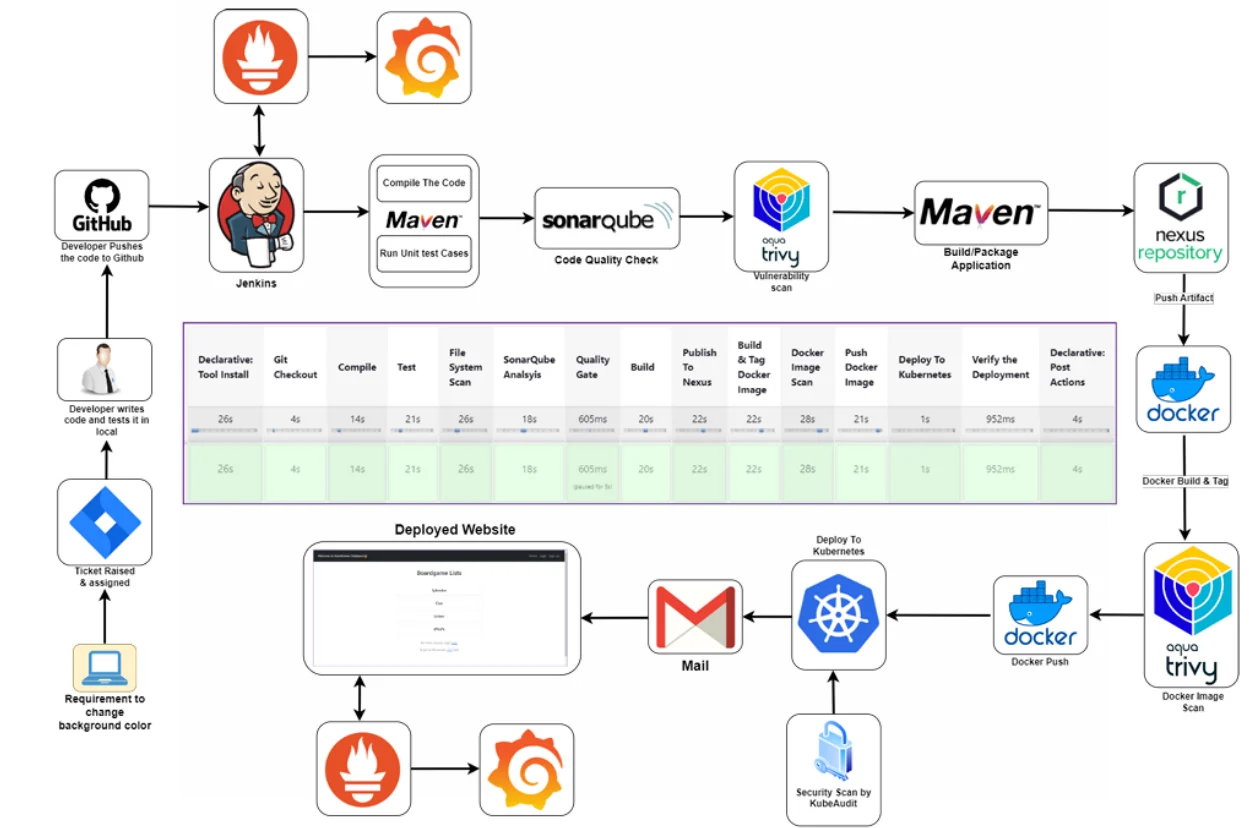
Pipeline Flow
- Source code checkout from repository
- Build and package application using Maven
- Static code analysis with SonarQube
- Artifact storage in Nexus Repository
- Docker image build
- Vulnerability scanning using Trivy
- Push Docker image to registry
- Deploy application to Kubernetes cluster
- Expose application using Kubernetes services
- Monitor application and infrastructure metrics
Key Features
⚙️ Fully automated Jenkins CI/CD pipeline
🧪 Build automation with Maven
🔍 Code quality analysis using SonarQube
🔐 Security scanning with Trivy
📦 Artifact management via Nexus
🐳 Docker-based containerization
☸️ Kubernetes deployment with load balancing
📊 Real-time monitoring using Prometheus & Grafana
📧 Email alerts for pipeline success/failure
Tech Stack
- CI/CD: Jenkins
- Build Tool: Maven
- Code Quality: SonarQube
- Security: Trivy
- Artifact Repository: Nexus
- Containerization: Docker
- Orchestration: Kubernetes
- Monitoring: Prometheus, Grafana
- Notifications: Gmail (Jenkins email integration)
- Cloud: AWS EC2
Monitoring & Observability
- Application and node-level metrics
- Kubernetes cluster health monitoring
- Grafana dashboards for visualization
- Proactive alerting for failures and performance issues
What This Project Demonstrates
- Practical DevOps and CI/CD expertise
- Strong understanding of Java application delivery
- DevSecOps mindset with integrated security checks
- Kubernetes-based deployment strategies
- Monitoring and observability best practices
Use Cases
- Reference DevOps CI/CD project
- Kubernetes deployment practice
- Resume and portfolio showcase
- Real-world DevOps workflow demonstration
Future Enhancements
- Helm-based Kubernetes deployments
- Horizontal Pod Autoscaler (HPA)
- Centralized logging (ELK / Loki)
- GitOps deployment with Argo CD
- Slack or Teams notifications
Results:
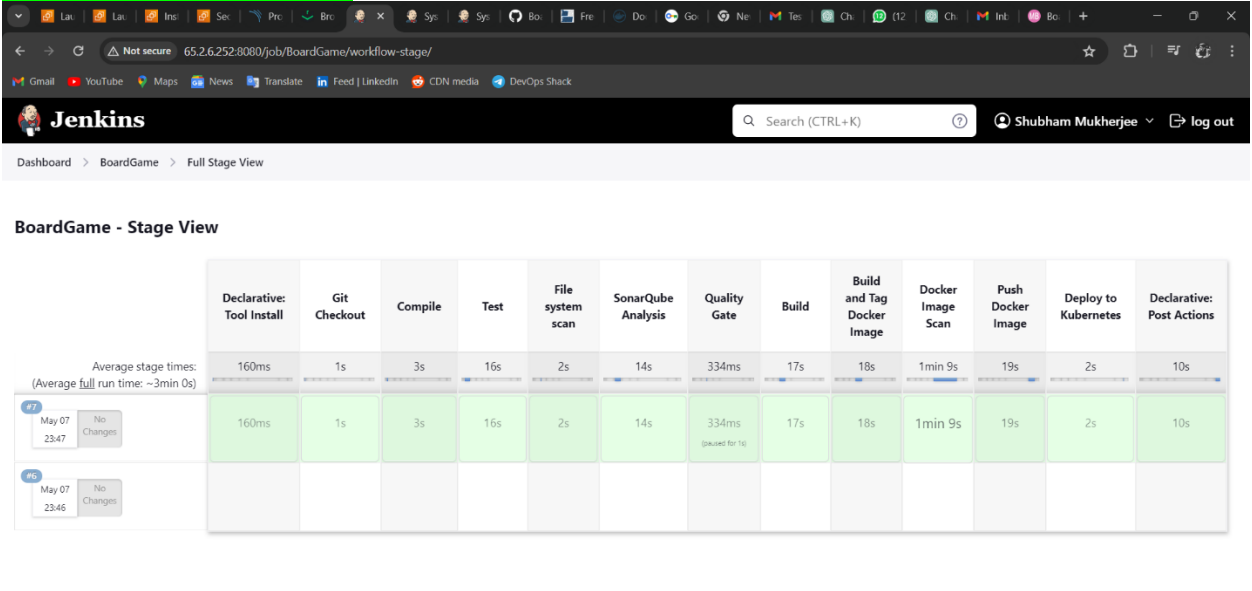
JENKINS PIPELINE:
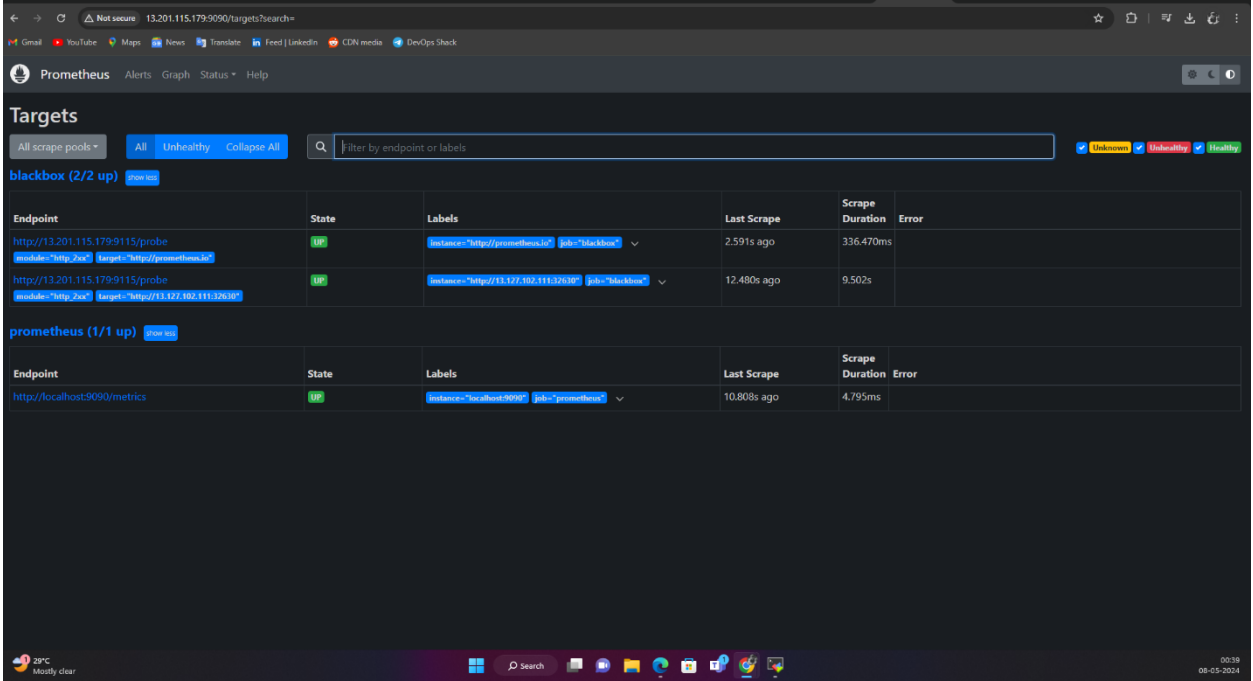
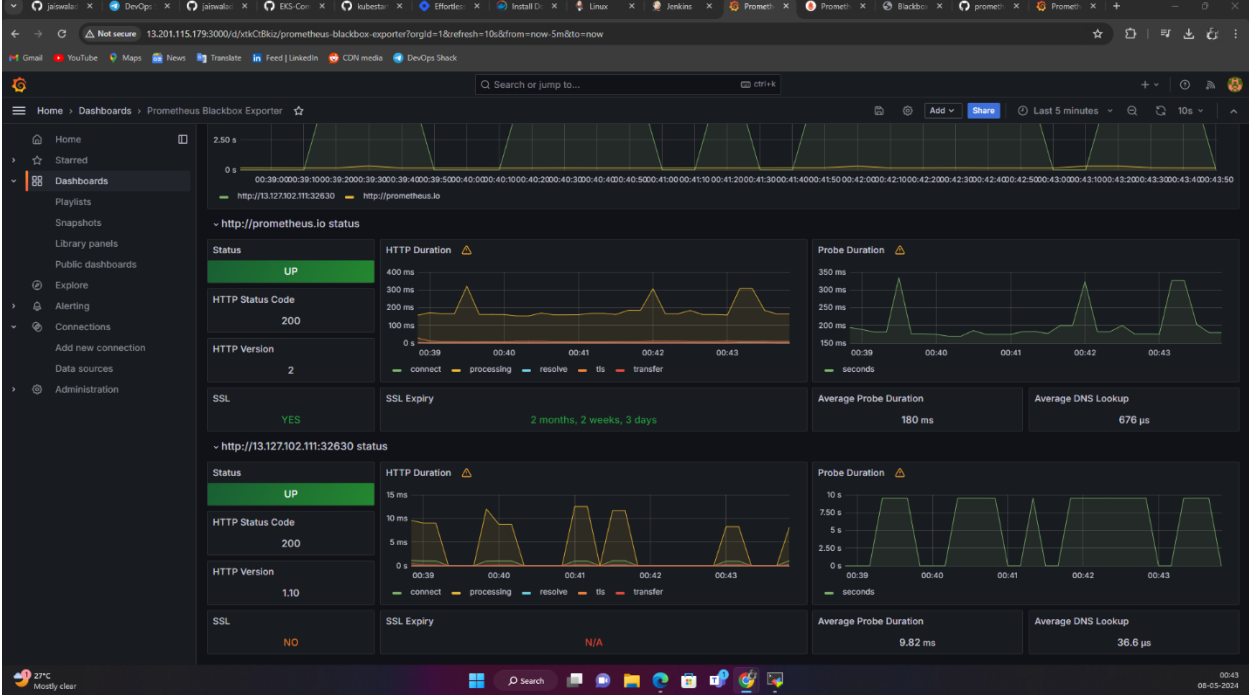
PROMETHEUS:
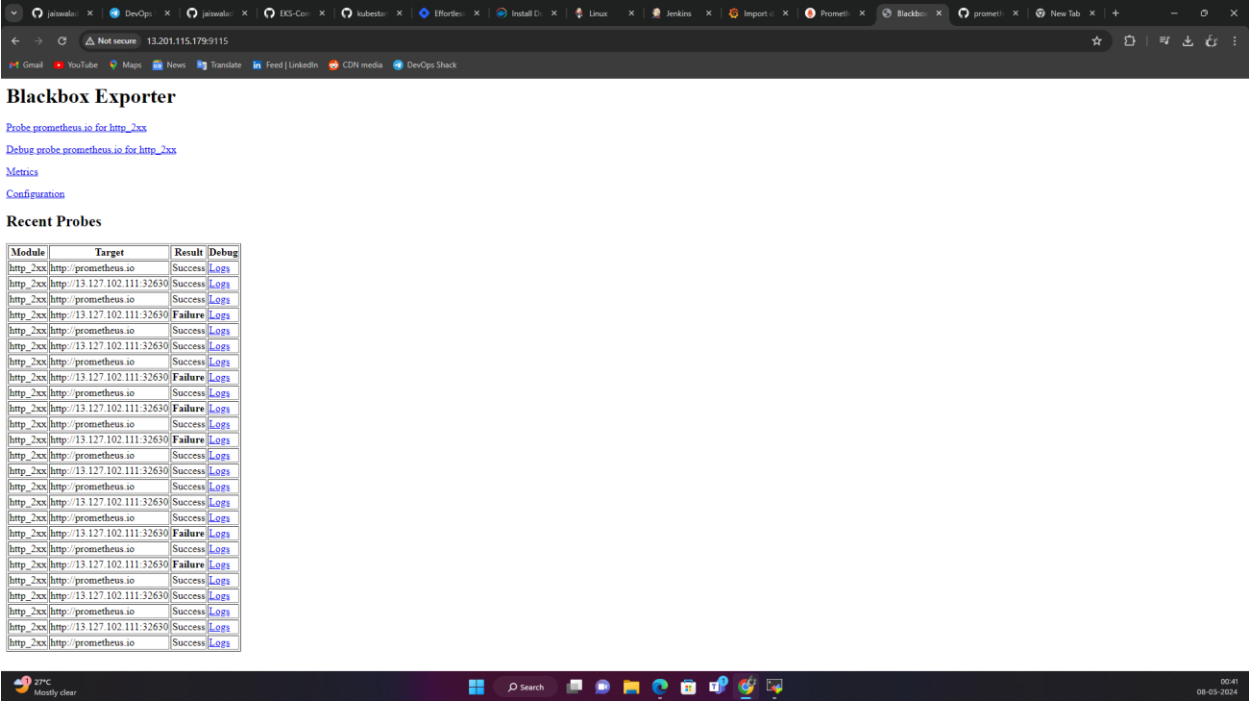
BLACKBOX:
GRAFANA:
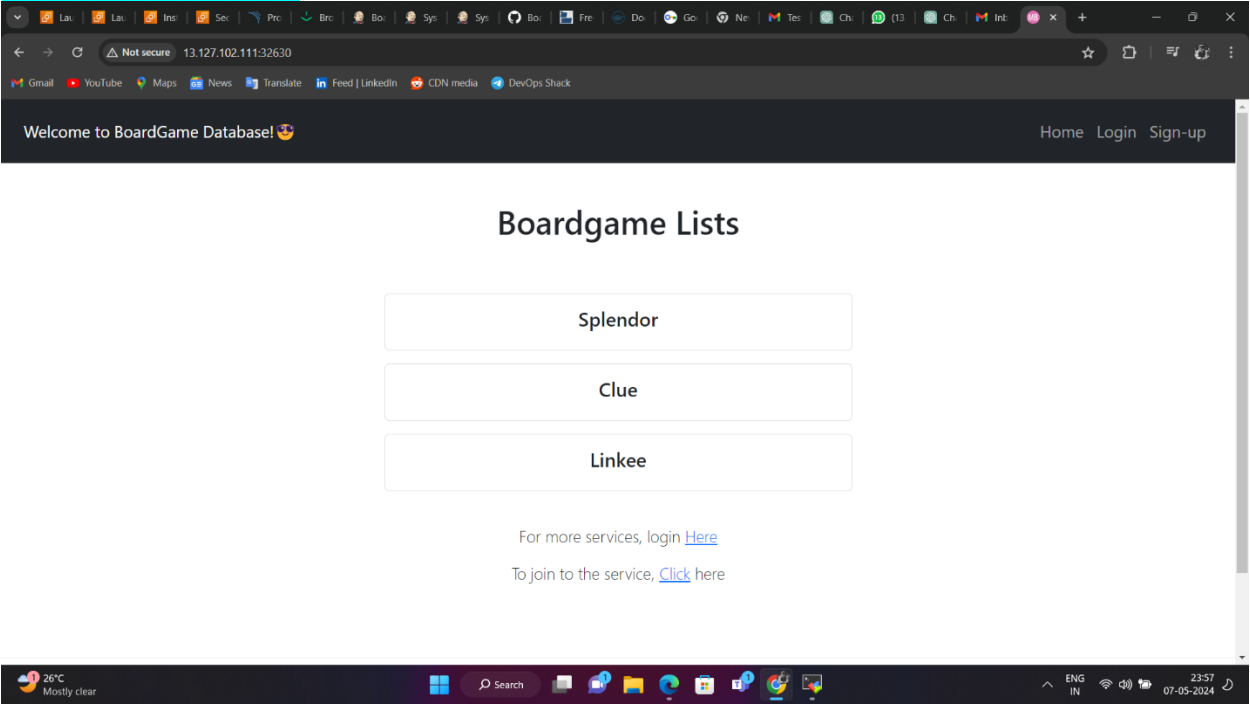
APPLICATION:
License
MIT License © 2025
Built to reflect real-world DevOps workflows, not just concepts 🚀
By Omprakash Chauhan